将实时传感器数据推送到 ASA 并可视化为近实时 (NRT) PowerBI 仪表板——物联网的前沿
💡一则或许对你有用的小广告
欢迎加入小哈的星球 ,你将获得:专属的项目实战 / 1v1 提问 / Java 学习路线 / 学习打卡 / 每月赠书 / 社群讨论
- 新项目:《从零手撸:仿小红书(微服务架构)》 正在持续爆肝中,基于
Spring Cloud Alibaba + Spring Boot 3.x + JDK 17...,点击查看项目介绍 ;- 《从零手撸:前后端分离博客项目(全栈开发)》 2 期已完结,演示链接: http://116.62.199.48/ ;
截止目前, 星球 内专栏累计输出 82w+ 字,讲解图 3441+ 张,还在持续爆肝中.. 后续还会上新更多项目,目标是将 Java 领域典型的项目都整一波,如秒杀系统, 在线商城, IM 即时通讯,权限管理,Spring Cloud Alibaba 微服务等等,已有 2900+ 小伙伴加入学习 ,欢迎点击围观
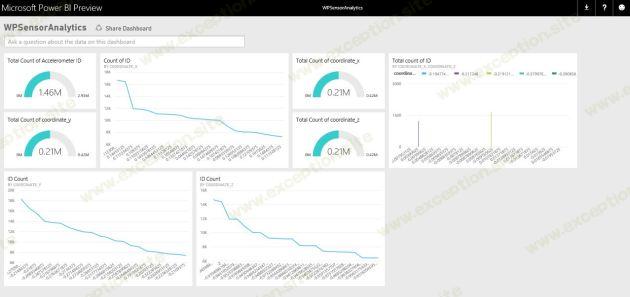
根据物联网基础材料的最后一个演示,我们已经看到如何利用来自社交媒体数据集(如 Twitter)的一些关键字的实时数据洞察力。 在此演示中,我们尝试将实时传感器数据从 Windows Phone 设备推送到 Azure 流分析(通过服务总线 EventHub 通道),并在 ASA 中心处理后发布到实时 PowerBI 仪表板或 PowerView 上的近实时分析 (NRT)对于 Excel,通过 Excel PowerQuery 将 ASA 事件推送到 Azure SQL 数据库。
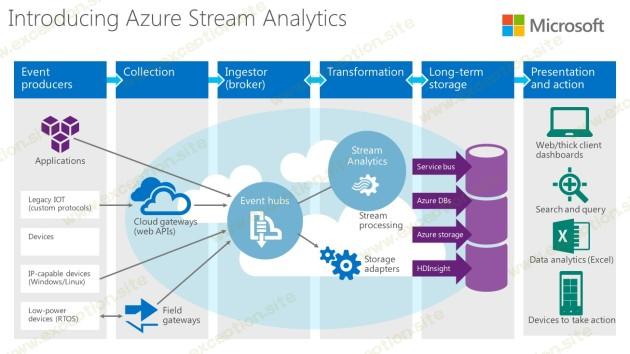
ASA on IoT Foundation 的 n 层架构概述如下:
同时, IoT 始终使客户能够将自己的设备连接到 Azure 云平台上并从中带来一些真正的商业价值,无论它产生#BigData 还是#SmallData 。
另一个非常重要的主题是从 博客或遥测数据 中获得洞察力,这些数据可以带来 良好的情绪,通过机器学习点击流分析值 。
物联网 团队进行了一次很好的高层 讨论 。
回到演示,首先实现了一个示例应用程序,用于在 Windows Phone 和 Windows 应用商店设备(通用应用程序)上生成加速度计 3D 事件(X、Y、Z)并将生成的事件作为块 blob 推送到 Azure 服务总线事件中心 .
附上示例代码片段。
private async void ReadingChanged(object sender, AccelerometerReadingChangedEventArgs e) { await Dispatcher.RunAsync(CoreDispatcherPriority.Normal, () => { AccelerometerReading reading = e.Reading; ScenarioOutput_X.Text = String.Format(“{0,5:0.00}”, reading.AccelerationX); ScenarioOutput_Y.Text = String.Format(“{0,5:0.00}”, reading.AccelerationY); ScenarioOutput_Z.Text = String.Format(“{0,5:0.00}”, reading.AccelerationZ); i++; //Coordinate_X = String.Format(“{0,5:00.00}”,Coordinate_X + ScenarioOutput_X.Text); //Coordinate_Y = String.Format(“{0,5:00.00}”, Coordinate_Y + ScenarioOutput_Y.Text); //Coordinate_Z = String.Format(“{0,5:00.00}”, Coordinate_Z + ScenarioOutput_Z.Text); dataDetails = i +”,”+ reading.AccelerationX + “,” + reading.AccelerationY + “,” + reading.AccelerationZ; NewDataFile += Environment.NewLine + dataDetails; }); CloudStorageAccount storageAccount = CloudStorageAccount.Parse(“DefaultEndpointsProtocol=https;AccountName=yourazurestorageaccountname; AccountKey=yourazurestorageaccountkey”); CloudBlobClient blobClient = storageAccount.CreateCloudBlobClient(); CloudBlobContainer container = blobClient.GetContainerReference(“accelerometer”); await container.CreateIfNotExistsAsync(); //if (x == false) //{ // await container.CreateAsync(); //} CloudBlockBlob blockBlob = container.GetBlockBlobReference(newFileName); // bool y = await blockBlob.ExistsAsync(); //if (!blockBlob.Equals(newFileName)) //{ container.GetBlockBlobReference(newFileName); // await blockBlob.UploadTextAsync(dataDetails); await blockBlob.UploadTextAsync(Headers + Environment.NewLine+ NewDataFile); }
您可以在 Github 上下载整个 visual studio 解决方案。
与往常一样,下一个挑战是 使用准确的消费者密钥将真实的传感器事件发送到事件中心,并一次将数百万个事件发布到事件中心 。
Here goes sample code snippet. class Program { static string eventHubName = “youreventhubname”; static string connectionString = GetServiceBusConnectionString(); static string data = string.Empty; static void Main(string[] args) { string csv_file_path = string.Empty; install(); //string csv_file_path = @””; string[] filePath = Directory.GetFiles(@”Your CSV Sensor Data file directory”, “*.csv”); int size = filePath.Length; for (int i = 0; i < size; i++) { Console.WriteLine(filePath[i]); csv_file_path = filePath[i]; } DataTable csvData = GetDataTableFromCSVFile(csv_file_path); Console.WriteLine(“Rows count:” + csvData.Rows.Count); DataTable table = csvData; foreach (DataRow row in table.Rows) { // Console.WriteLine(“—Row—“); foreach (var item in row.ItemArray) { data = item.ToString(); Console.Write(data); var eventHubClient = EventHubClient.CreateFromConnectionString(connectionString, eventHubName); //while (true) //{ try { foreach (DataRow rows in table.Rows) { var info = new Accelerometer { ID = rows.ItemArray[0].ToString(), Coordinate_X = rows.ItemArray[1].ToString(), Coordinate_Y = rows.ItemArray[2].ToString(), Coordinate_Z = rows.ItemArray[3].ToString() }; var serializedString = JsonConvert.SerializeObject(info); var message = data; Console.WriteLine(“{0}> Sending events: {1}”, DateTime.Now.ToString(), serializedString.ToString()); eventHubClient.SendAsync(new EventData(Encoding.UTF8.GetBytes(serializedString.ToString()))); } } catch (Exception ex) { Console.ForegroundColor = ConsoleColor.Red; Console.WriteLine(“{0} > Exception: {1}”, DateTime.Now.ToString(), ex.Message); Console.ResetColor(); } Task.Delay(200); //} } } // Console.ReadLine(); Console.WriteLine(“Press Ctrl-C to stop the sender process”); Console.WriteLine(“Press Enter to start now”); Console.ReadLine(); // SendingRandomMessages().Wait(); } public static void install() { string url = @”https://…………blob.core.windows.net/accelerometer/AccelerometerSensorData.csv”; WebClient wc = new WebClient(); wc.DownloadFileCompleted += new AsyncCompletedEventHandler(Completed); wc.DownloadProgressChanged += new DownloadProgressChangedEventHandler(ProgressChanged); // Console.WriteLine(“Download OnProgress……”); ConsoleHelper.ProgressTitle = “Downloading”; ConsoleHelper.ProgressTotal = 10; for (int i = 0; i <= 10; i++) { ConsoleHelper.ProgressValue = i; Thread.Sleep(500); if (i >= 5) { ConsoleHelper.ProgressHasWarning = true; } if (i >= 8) { ConsoleHelper.ProgressHasError = true; } } ConsoleHelper.ProgressTotal = 0; try { wc.DownloadFile(new Uri(url), @”\ASA\Sensors\Accelerometer\AccelerometerSensorData.csv”); } catch (Exception ex) { while (ex != null) { Console.WriteLine(ex.Message); ex = ex.InnerException; } } } public static void Completed(object sender, AsyncCompletedEventArgs e) { Console.WriteLine(“Download Completed!”); } public static void ProgressChanged(object sender, DownloadProgressChangedEventArgs e) { Console.WriteLine(“{0} Downloaded {1} of {2} bytes,{3} % Complete….”, (string)e.UserState, e.BytesReceived, e.TotalBytesToReceive, e.ProgressPercentage); DrawProgressBar(0, 100, Console.WindowWidth, '1'); } private static void DrawProgressBar(int complete, int maxVal, int barSize, char ProgressCharacter) { Console.CursorVisible = false; int left = Console.CursorLeft; decimal perc = (decimal)complete / (decimal)maxVal; int chars = (int)Math.Floor(perc / ((decimal)1 / (decimal)barSize)); string p1 = String.Empty, p2 = String.Empty; for (int i = 0; i < chars; i++) p1 += ProgressCharacter; for (int i = 0; i < barSize – chars; i++) p2 += ProgressCharacter; Console.ForegroundColor = ConsoleColor.Green; Console.Write(p1); Console.ForegroundColor = ConsoleColor.DarkGreen; Console.Write(p2); Console.ResetColor(); Console.Write(“{0}%”, (perc * 100).ToString(“N2″)); Console.CursorLeft = left; } private static DataTable GetDataTableFromCSVFile(string csv_file_path) { DataTable csvData = new DataTable(); string data = string.Empty; try { using (TextFieldParser csvReader = new TextFieldParser(csv_file_path)) { csvReader.SetDelimiters(new string[] { “,” }); csvReader.HasFieldsEnclosedInQuotes = true; //read column names string[] colFields = csvReader.ReadFields(); foreach (string column in colFields) { DataColumn datecolumn = new DataColumn(column); datecolumn.AllowDBNull = true; csvData.Columns.Add(datecolumn); } while (!csvReader.EndOfData) { string[] fieldData = csvReader.ReadFields(); for (int i = 0; i < fieldData.Length; i++) { if (fieldData[i] == “”) { fieldData[i] = null; } } csvData.Rows.Add(fieldData); } } } catch (Exception ex) { } return csvData; }
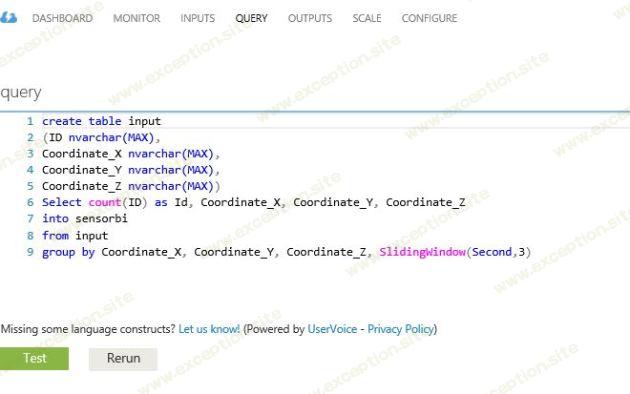
现在,像本演示中那样构建具有特定窗口间隔的 ASA SQL 查询,使用“ SlidingWindow(Second,no of interval)”根据窗口中提到的特定时间间隔对事件中心数据生成计算 。
接下来,通过选择
ASA 作业的“输出”选项卡,开始在 PowerBI 预览门户上实施处理后的输出可视化。一次,您提供输出的所有数据集名称并启动 ASA 作业
,在 PowerBI 门户上,将能够看到创建的特定数据集旁边有一个
黄色的小星形图标
。

我的 Youtube 频道上提供了视频的分步演示。
 异常教程
异常教程


