学习 R – 如何使用 GGPlot 创建多个密度图
💡一则或许对你有用的小广告
欢迎加入小哈的星球 ,你将获得:专属的项目实战(已更新的所有项目都能学习) / 1v1 提问 / Java 学习路线 / 学习打卡 / 每月赠书 / 社群讨论
- 新开坑项目:《Spring AI 项目实战》 正在持续爆肝中,基于 Spring AI + Spring Boot 3.x + JDK 21..., 点击查看 ;
- 《从零手撸:仿小红书(微服务架构)》 已完结,基于
Spring Cloud Alibaba + Spring Boot 3.x + JDK 17...,点击查看项目介绍 ;演示链接: http://116.62.199.48:7070 ;- 《从零手撸:前后端分离博客项目(全栈开发)》 2 期已完结,演示链接: http://116.62.199.48/ ;
截止目前, 星球 内专栏累计输出 100w+ 字,讲解图 4013+ 张,还在持续爆肝中.. 后续还会上新更多项目,目标是将 Java 领域典型的项目都整一波,如秒杀系统, 在线商城, IM 即时通讯,权限管理,Spring Cloud Alibaba 微服务等等,已有 3700+ 小伙伴加入学习 ,欢迎点击围观
本文介绍的 代码示例 可用于使用 r 编程 语言中的 ggplot2 包创建多条密度曲线或绘图 。如果我遗漏了一个或多个要点,请随时发表评论/建议。
带有 ggplot 的多密度曲线/图形
下面给出的代码示例适用于作为 ggplot2 包 的一部分加载的“钻石”数据集。以下是下面显示的两种不同类型的图:
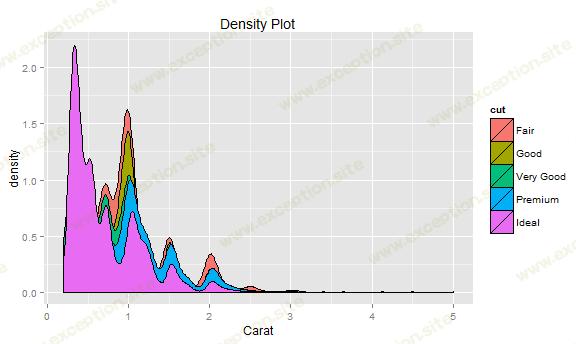
- 具有多个填充的密度图
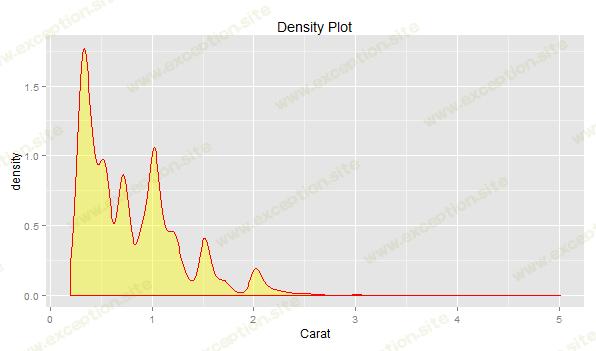
- 单填充密度图
具有多个填充的密度图
以下代码表示具有多个填充的密度图。注意传递给“aes”方法的“fill”参数。

 # create density plots for single variable filtered by fill condition
# in example below, fill is assigned to cut
ggplot(diamonds, aes(x=carat, fill=cut)) + geom_density() +
  labs(title="density plot", x="carat")
单填充密度图
 # create density plots for single variable filtered by fill condition
# in example below, fill is assigned to cut
ggplot(diamonds, aes(x=carat, fill=cut)) + geom_density() +
  labs(title="density plot", x="carat")
 异常教程
异常教程
